Fractals
I have endeavored to write these applets in order to better understand the
nature of fractals.
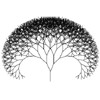 A
tree fractal, good for visualizing the concept of infinite complexity
stemming (literally) from a single simple "function". In this applet, you can
modify the recursive rule in terms of the angle of branching and the size
ratio between successive branches.
A
tree fractal, good for visualizing the concept of infinite complexity
stemming (literally) from a single simple "function". In this applet, you can
modify the recursive rule in terms of the angle of branching and the size
ratio between successive branches.
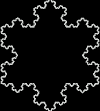 The Koch
Curve. This curve when iterated infinitely is continuous but nowhere
differentiable, has a finite area but and infinite perimeter. With particular
settings, the tree fractal can achieve the same shape of the Koch Curve.
Click here to see it.
The Koch
Curve. This curve when iterated infinitely is continuous but nowhere
differentiable, has a finite area but and infinite perimeter. With particular
settings, the tree fractal can achieve the same shape of the Koch Curve.
Click here to see it.
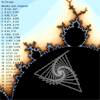
 The
Mandlebrot set; the iterative function Zn = Z(n+1)^2 + C
mapped on the complex plane. Z is initially zero, and C is the point from which
you start. In this example applet, the function is iterated 90 times for each
pixel (each pixel represents a point on the complex plane, which is C in the
function above.) The color is defined by how many iterations it takes for the new Z
point to go further than 2 away from the origin. (is can be mathematically
proven that once the point goes outside this bound, it will always go off to
infinity. In this case, the point is not "in the set") If Z does not go outside
this bound after 90 iterations, it is assumed that it will never go off to
infinity, and it is deemed "in the set" and colored black. fractal explorer
explains fractals very well.
The
Mandlebrot set; the iterative function Zn = Z(n+1)^2 + C
mapped on the complex plane. Z is initially zero, and C is the point from which
you start. In this example applet, the function is iterated 90 times for each
pixel (each pixel represents a point on the complex plane, which is C in the
function above.) The color is defined by how many iterations it takes for the new Z
point to go further than 2 away from the origin. (is can be mathematically
proven that once the point goes outside this bound, it will always go off to
infinity. In this case, the point is not "in the set") If Z does not go outside
this bound after 90 iterations, it is assumed that it will never go off to
infinity, and it is deemed "in the set" and colored black. fractal explorer
explains fractals very well.
 This
applet shows you what the computer is doing and where the iterations of the
function go. when you move your mouse, it draws lines between the successive
points given by iterating the function. Very interesting things happen inside
the set towards the edges and inside the knobs. It looks like the knobs arise
when the iterations loop back on themselves and form a "stable" geometric shape,
and inside the knobs there are variations on that shape.
This
applet shows you what the computer is doing and where the iterations of the
function go. when you move your mouse, it draws lines between the successive
points given by iterating the function. Very interesting things happen inside
the set towards the edges and inside the knobs. It looks like the knobs arise
when the iterations loop back on themselves and form a "stable" geometric shape,
and inside the knobs there are variations on that shape.
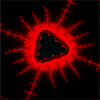 This
is the function Zn = (Z(n+1)^2 + C)^2, which
gives a totally different shape than Z(n+1)^2 + C.
This
is the function Zn = (Z(n+1)^2 + C)^2, which
gives a totally different shape than Z(n+1)^2 + C.